Reports
The Reports area gives you a clear picture of what's happening — how many applications come in, how inspections are going, and how your team is performing.
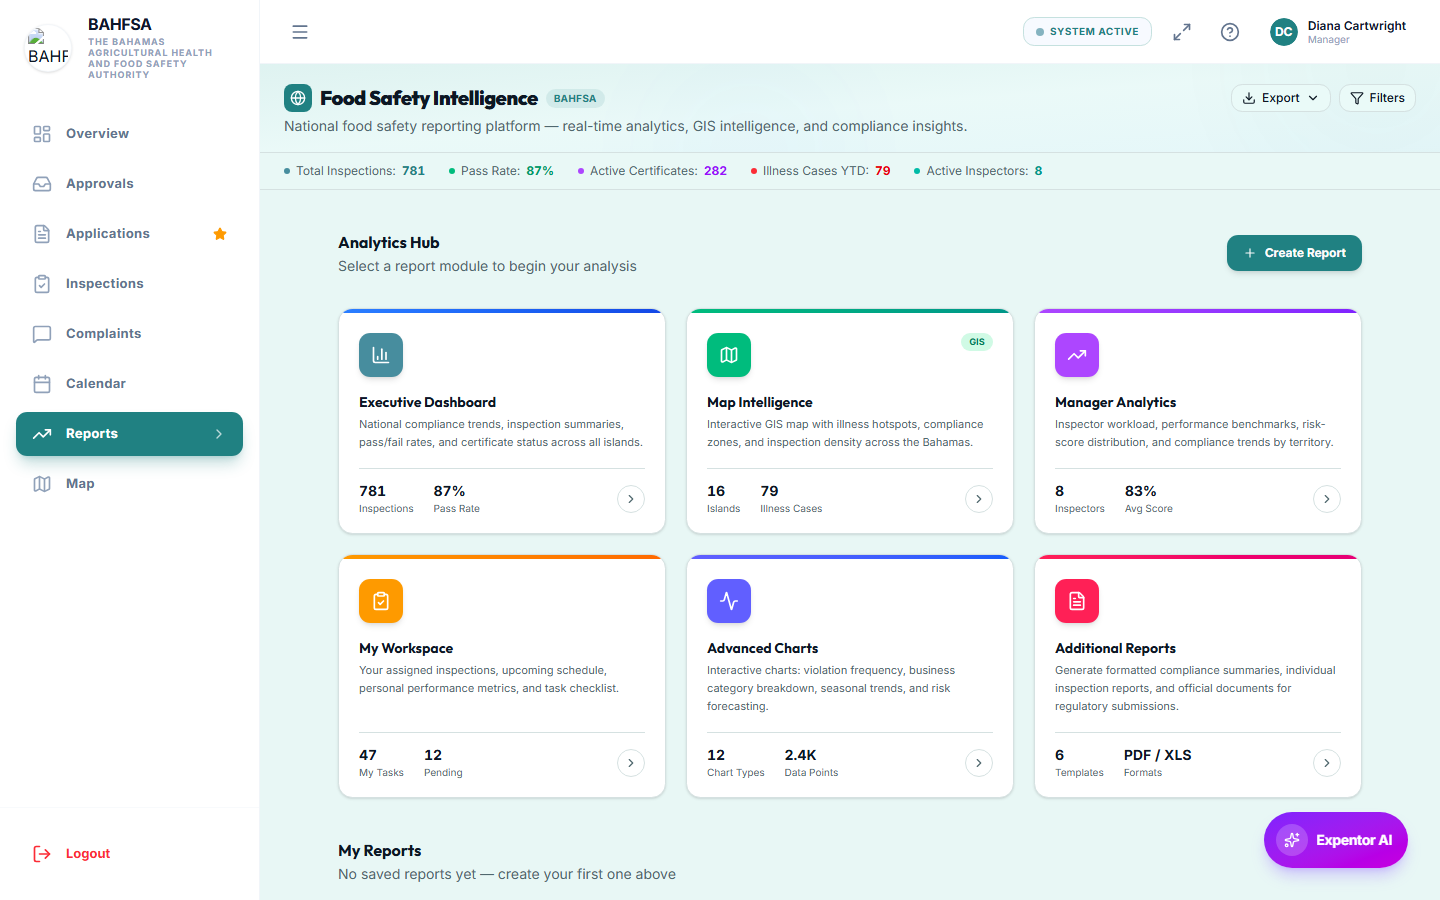 Dashboards with charts and figures, filterable by date, island, inspector, and more.
Opening reports
In the menu, select Reports. You'll find several dashboards with charts and figures.
What you can see
| Report | Tells you |
|---|---|
| Executive summary | Headline totals — applications, submitted, approved, pending. |
| Monthly trend | How volumes change over time. |
| By island | Where activity is concentrated. |
| Inspector performance | How much each inspector is completing, and how. |
| Status breakdown | How many cases are at each stage. |
| Certificates issued | Certificates over time. |
| By business type | Which kinds of businesses are most active. |
| Score distribution | The spread of inspection scores. |
| Recent & overdue | Latest inspections and any that are running late. |
Filtering
Use the filters to focus a report — for example by date range, island, inspector, business type, or status. The charts update to match.
Ask a question (AI assistant)
There's an AI assistant that answers plain-language questions about your data — for example, "How many inspections were approved last month on Grand Bahama?" Type your question and it answers using the latest figures. It's a quick way to get an answer without building a report by hand.
Exporting
You can export reports to share or keep — for example as a PDF or spreadsheet — using the export options on the screen.